Unrivaled Synaptic Activity Mapping with High-Density CMOS-MEA
# Precision Neuroelectrophysiology – Unveiling Synaptic Connectivity in Unmatched Detail
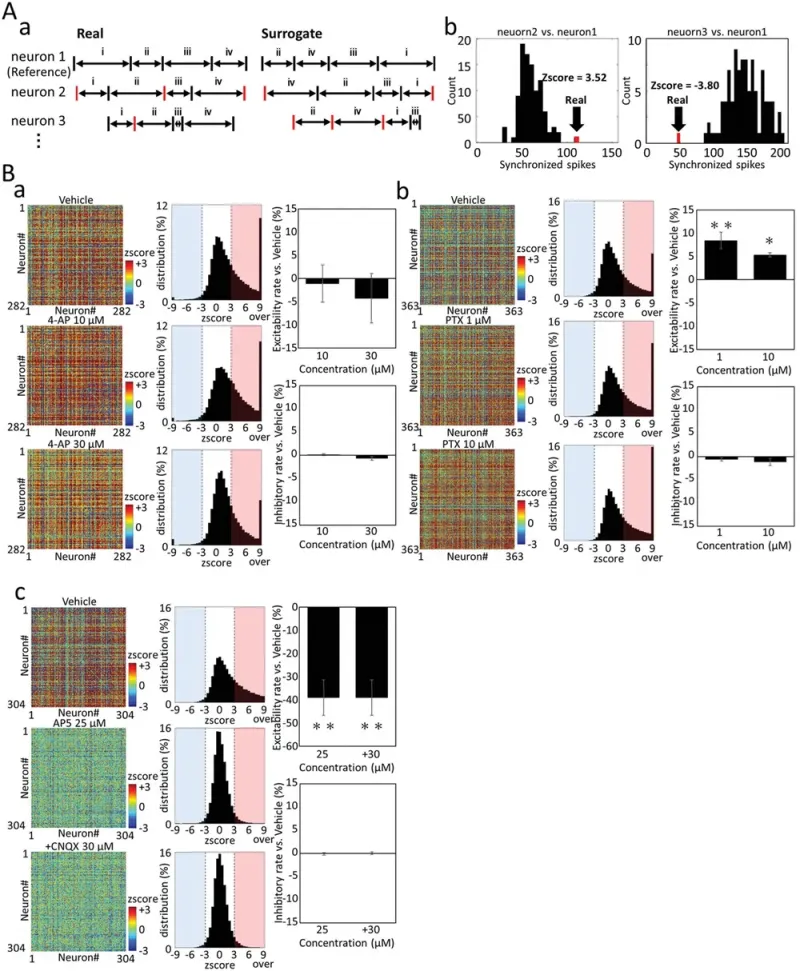
High-density (HD) CMOS-MEA with 236880-electrode enables unprecedented resolution of activity recordings as well as advanced parameter analysis. The study evaluates changes in synaptic strength in hiPSC-derived cortical neurons using a high-density CMOS-MEA system by analyzing synchronized firing patterns. Neuronal activity was assessed by extracting firing time-series data and calculating synchronized spikes within 100 ms across neuron pairs. A Z score analysis compared real and surrogate spike data to classify neuronal connections as excitatory (Z ≥ 3) or inhibitory (Z ≤ -3).
Before drug administration, 33.5% of neuronal connections were excitatory. The effects of three compounds were examined:
- 4-AP reduced excitability connections (-1.08% to -4.25%) with minimal changes in inhibition.
- PTX significantly increased excitatory connections (up to +8.44%, p < 0.01), enhancing synaptic coupling and promoting regular firing patterns.
- AP5 + CNQX blocked excitatory connections (-39.04%), confirming glutamatergic inhibition.
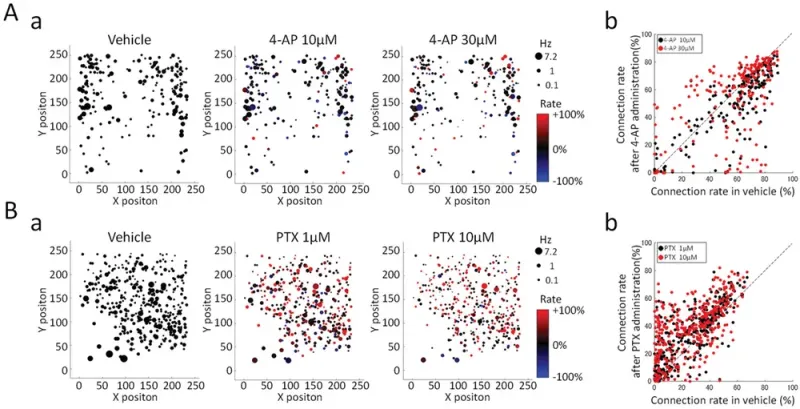
Single-neuron analysis of excitability connection rates (ECR) revealed distinct effects of 4-AP and PTX.
- 4-AP caused ECR reductions in ~80% of neurons at low concentrations, while higher doses led to both increases and decreases.
- PTX increased ECR in ~80% of neurons at all doses, with a broader effect at higher concentrations.
These findings demonstrate the capability of high-density CMOS-MEA to analyze synaptic connectivity and drug-induced neural network changes with single-cell resolution.

Changes in the synaptic strength due to compound administration in hiPSC-derived cortical neurons. A) Z score calculation to quantify connection strength between neurons. (a) Raster plot of three representative neurons. Left: real data, right: random surrogate data. Red raster plots show spikes that fire within 100 ms of neuron1 firing. (b) Synchronized spike histogram calculated from spike trains of neuron2 and neuron1 (left) and synchronized spike histogram calculated from spike trains of neuron3 and neuron1 (right). Black indicates random surrogate data, red indicates a synchronized spike of real data. B) Changes in Z score due to compound administration. (a) vehicle (Top), 4-AP 10 μm (middle), 4-AP 100 μm (Low). (b) vehicle (Top), PTX 1 μm (middle), PTX 10 μm (low). (c) Vehicle (Top), AP-5 25 μm (middle), AP-5 25 μm+CNQX 30 μm (Low). Left: Matrix of Z scores between each neuron before and after compound administration. The color scale is −3 ≤ Z score ≤ 3. Middle: Z score histogram of all connections. The red area (Z score ≥ 3) indicates an excitable connection, and the blue area (Z score ≤ 3) indicates an inhibitory connection. Right: Excitability connections percentage change (top, Ave. ±S.E., n = 3) and inhibitory connections percentage change (low, Ave. ±S.E., n = 3) due to compounds administration (* : p ≦ 0.05, ** : p ≦ 0.01 vs vehicle, Dunnett's test).

Changes in firing frequency of single neuron and excitability connection rate (ECR) after 4-AP and PTX administration. There were positions of neurons where the firing was detected on the 59220 electrodes (235 × 252 electrodes) and firing frequencies in single neurons. The firing frequency is indicated by the size of the circle. The size of the circle indicates the firing frequency. The ECR value of each neuron in vehicle is defined as 100%, and the ECR increase/decrease due to drug administration is shown in color. A-a) Vehicle, 4-AP 10 μm, 30 μm. B-a) Vehicle, PTX 1 μm, 10 μm. A-b) 4-AP 10 μm, 30 μm. B-b) Vehicle, PTX 1 μm, 10 μm.