Predicting Seizurogenic Dose Levels with MEA and PCA for In Vitro to In Vivo Extrapolation
# Advanced MEA analytics enhance seizure liability predictions, reducing reliance on animal testing
This assay presents a predictive method for assessing seizure liability using microelectrode array (MEA) assays combined with principal component analysis (PCA). By evaluating in vitro neural activity in co-cultured human iPSC-derived neurons with astrocytes, researchers established correlations between MEA data and in vivo cerebrospinal fluid (CSF) concentrations of convulsants. The findings support the potential of MEA assays to replace animal experiments by providing accurate in vitro to in vivo extrapolation (IVIVE) for seizurogenic risk assessment.

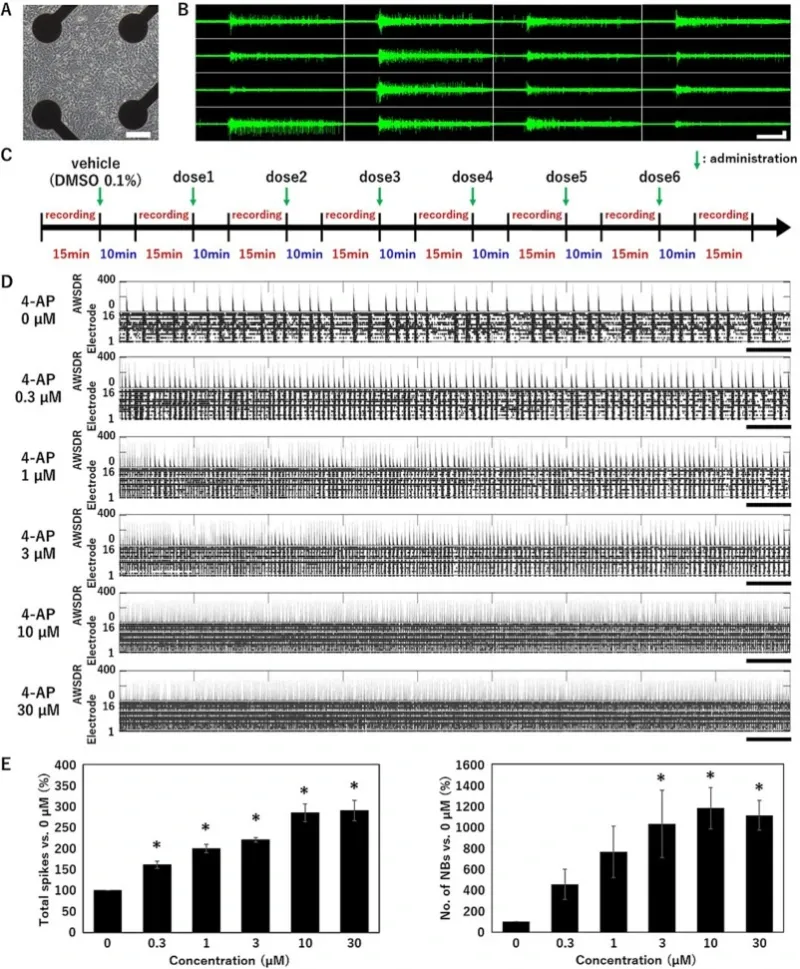
Spontaneous firing in human iPSC-derived neurons.
(A) Phase contrast of neurons cultured on a microelectrode array (MEA) at 5 weeks in vitro (5WIV). Scale bar = 100 μm. (B) Typical network burst waveform of the spontaneous activity measured at 5WIV. Horizontal scale bar = 1 s. Vertical scale bar = 30 μV. (C) Treatment scheme for the MEA experiments. (D) Raster plot of spikes and array-wide spike detection rate

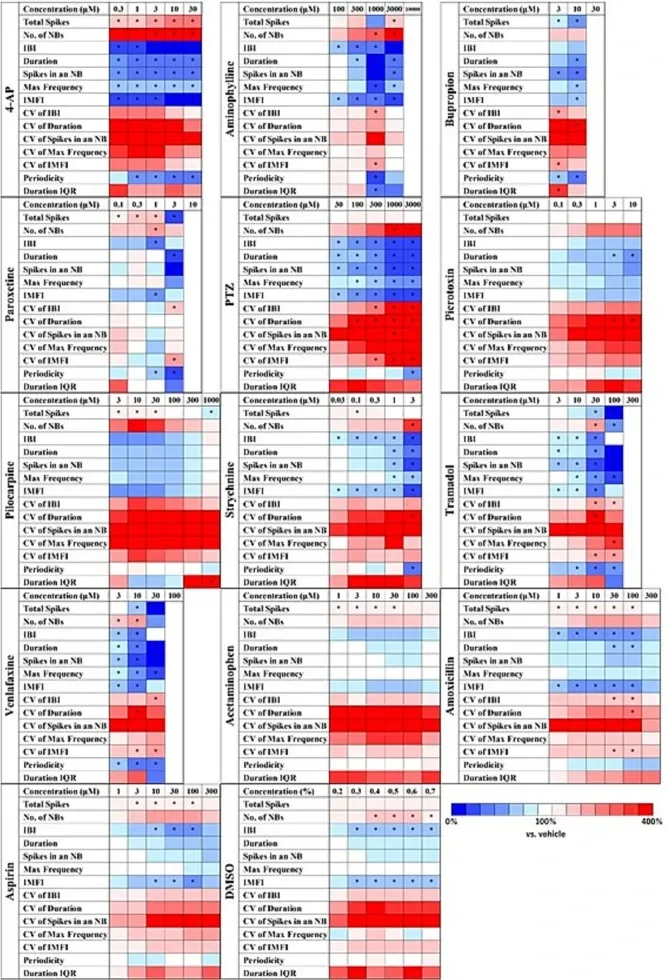
Heat maps of analytical parameters with different seizurogenic compounds and negative controls in human iPSC-derived neurons.
Seizurogenic compounds: 4-aminopyridine (4-AP, n = 6 wells), aminophylline (n = 6 wells), bupropion (n = 6 wells), paroxetine (n = 6 wells), 1,5-pentamethylene-tetrazole (PTZ, n = 7 wells), picrotoxin (n = 8 wells), pilocarpine (n = 6 wells), strychnine (n = 6 wells), tramadol (n = 6 wells), and venlafaxine (n = 6 wells). Negative controls: acetaminophen (n = 6 wells), amoxicillin (n = 6 wells), aspirin (n = 6 wells), and vehicle: DMSO (n = 6 wells). One-way ANOVA: p < 0.05 (Total spikes, number of NBs, IBI, Duration, Spikes in an NB, Max frequency, IMFI, CV of IBI, CV of duration, CV of spikes in an NB, CV of max frequency, CV of IMFI, Periodicity, Duration IQR), One-way ANOVA followed by Dunnett's test, *p < 0.05 vs. vehicle.

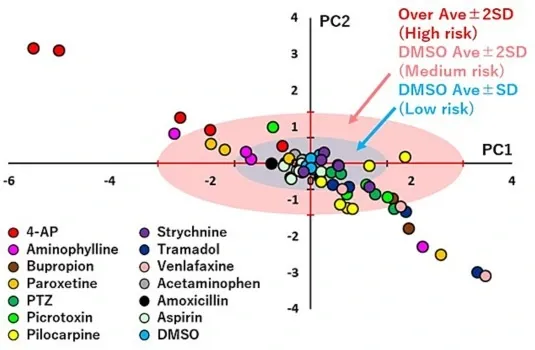
Scatter plots of PCA using the effective parameter set to eliminate the effect of DMSO in human iPSC-derived neurons.
Centroid plot of PC1 and PC2 for each concentration of the following test compounds: 4-aminopyridine (4-AP, n = 6 wells), aminophylline (n = 6 wells), bupropion (n = 6 wells), paroxetine (n = 6 wells), 1,5-pentamethylene-tetrazole (PTZ, n = 7 wells), picrotoxin (n = 8 wells), pilocarpine (n = 6 wells), strychnine (n = 6 wells), tramadol (n = 6 wells), venlafaxine (n = 6 wells), acetaminophen (n = 6 wells), amoxicillin (n = 6 wells), aspirin (n = 6 wells), and DMSO (n = 6 wells). The seizurogenic potential was quantitatively predicted by comparing each test compound with the standard deviation (SD) of DMSO. Low risk is indicated by the lower SD range (blue), medium risk by 2 SD (pink), and high risk by >2 SD (red). (For interpretation of the references to color in this figure legend, the reader is referred to the web version of this article.)

Verification of in vitro to in vivo extrapolation in human iPSC-derived neurons.
Correlation between the concentration at which neuronal activity >SD range of DMSO was detected in MEA experiments and CSF concentrations during tremors and convulsions. The red line indicates the concentration ratio. At 0.3–3, the MEA and CSF concentrations are the same because the common ratio of the concentration in MEA was 3. (A) Correlation between the concentration at which neuronal activity >SD range of DMSO was detected from MEA experiments and rat CSF concentrations during tremor. (B) Correlation between the concentration at which neuronal activity >SD range of DMSO was detected from MEA experiments and rat CSF concentrations during convulsion. 4-AP: 4-aminopyridine. PTZ: 1,5-pentamethylene-tetrazole. (For interpretation of the references to color in this figure legend, the reader is referred to the web version of this article.)