In Vitro EEG for Seizure Liability & Antiepileptic Drug Screening
# Advancing Preclinical Seizure Risk Assessment with In Vitro EEG
Explore how in vitro EEG analysis of brain organoids coupled with microelectrode arrays (MEA) provides a reliable method for assessing seizure liability and screening antiepileptic drugs. Discover insights into drug safety and neuropharmacology.

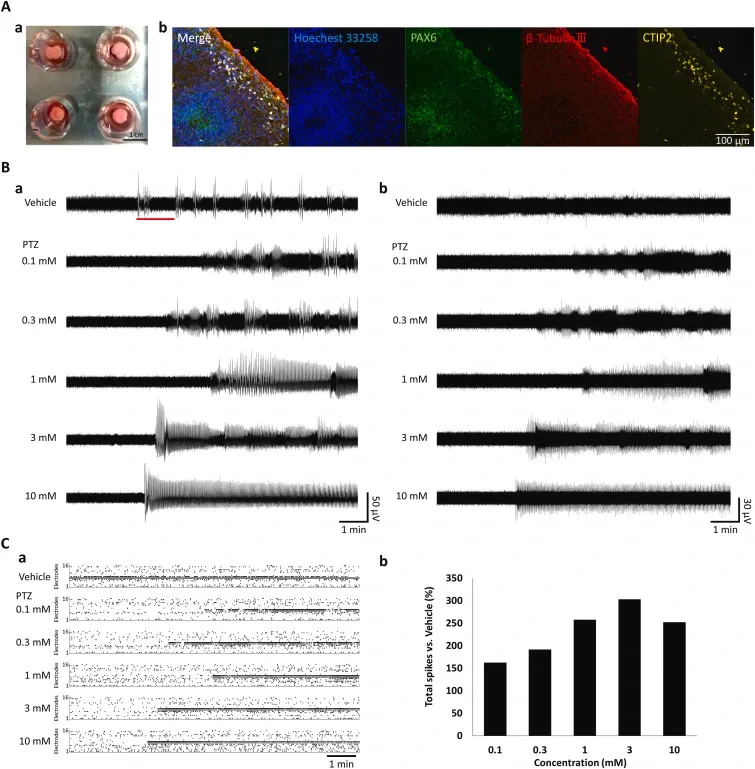
Microelectrode array (MEA) recording to pentylenetetrazol (PTZ) administration in 4-month cerebral organoids.
(A) a: Brain organoid on MEA. b: Characterization of brain organoids by immunocytochemistry. Hoechst 33, 258 (blue), aired box protein 6 (PAX6, green), β-Tubulin Ⅲ (red), CTIP2 (yellow). (B) Spontaneous activities after 10 min in PTZ administration. a: Spontaneous activities raw waveforms. b: Waveforms with components below 100 Hz removed in a high-pass filter. (C) Changes in multiunit activities after PTZ administration. a: Raster plots in all 16 electrodes. b: Change in the total number of spikes versus vehicle.

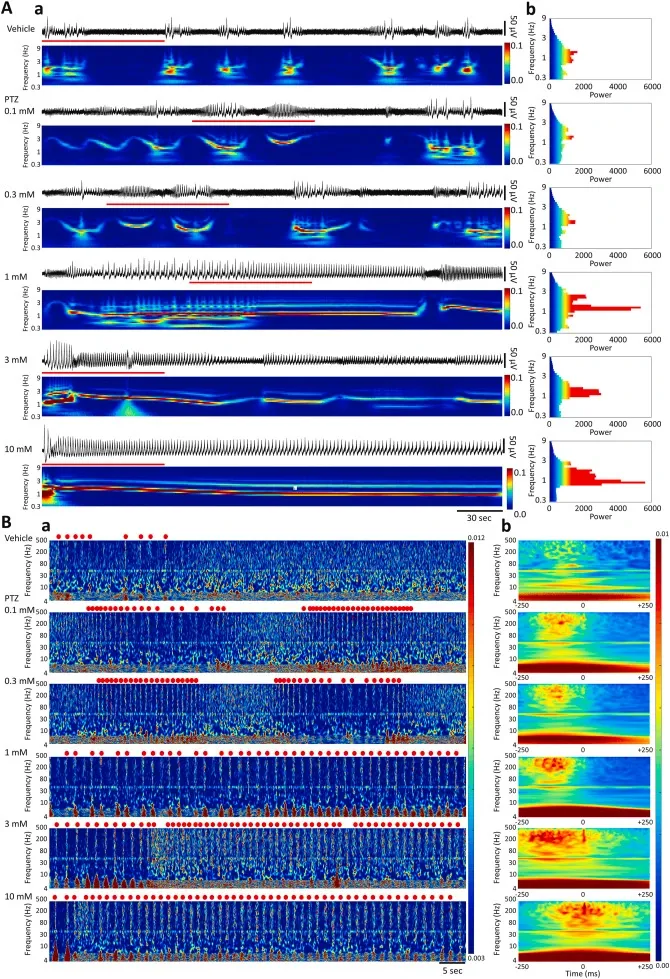
Frequency analysis below 500 Hz in PTZ administration.
(A) a: Raw waveforms for 5 min and the scalogram of 0.3–9 Hz. Enlarged view of red line part in Fig. 1B a. b: The histogram of frequency power in 0.3–9 Hz. (B) a: Scalogram of 4–500 Hz for 80 s in the red line part of A-a. Red dots indicate detected synchronized activities. b: Average value of frequency power in detected synchronized activities. The scalogram with peak detection time ±250 ms. Vehicle (n = 9), 0.1 mM (n = 44), 0.3 mM (n = 39), 1 mM (n = 41), 3 mM (n = 55), 10 mM (n = 51).

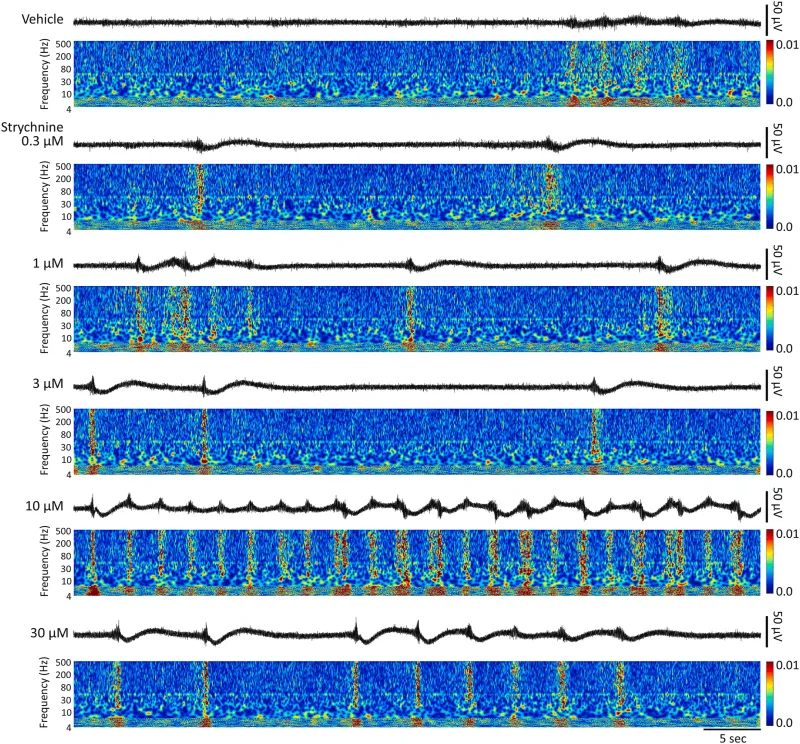
Responses to strychnine in 4-month cerebral organoids.
Raw waveform and scalogram of electrical activities in strychnine administration. A wavelet analysis was computed of the characteristic raw waveform (4–500 Hz) for 60 s in strychnine administration.

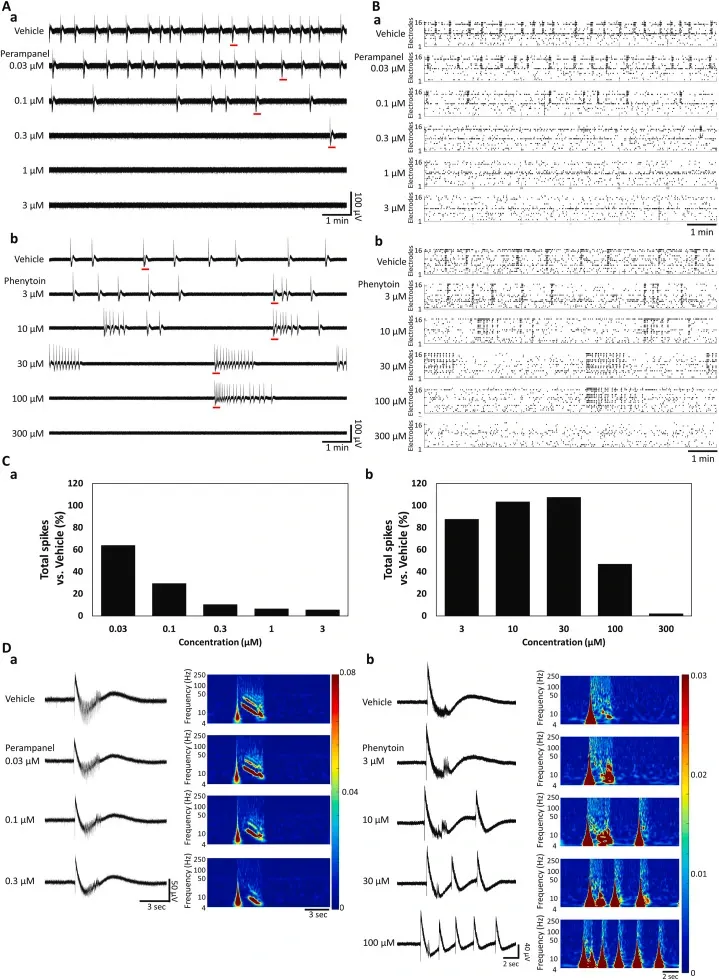
Responses to antiepileptic drugs (AEDs) in 4-month cerebral organoids.
(A) Raw waveforms of spontaneous activities for 10 min in AEDs administration. (a) Perampanel. (b) Phenytoin. (B) Representative raster plots at all 16 electrodes for 10 min. (a) Perampanel. (b) Phenytoin. (C) Changes in multiunit activities. (a) Perampanel. (b) Phenytoin. (D) Frequency analysis in on oscillation in the red line part of A-a and b. The characteristic typical raw waveforms (left) and 4–250 Hz scalograms (Right) after AEDs administration for 15 s. (a) Perampanel. (b) Phenytoin.