In Vitro Addiction Assessment Using MEA in Human iPSC-Derived Dopaminergic Neurons
# Advancing Addiction Research with Human-Relevant, High-Throughput Neural Activity Assessment
This study presents an innovative in vitro method for assessing addiction potential of compounds using microelectrode array (MEA) measurements in human iPSC-derived dopaminergic neurons. By analyzing neural activity before and after chronic exposure, this approach offers a high-throughput alternative to animal testing, enhancing drug screening and neurotoxicology research.
Details of test compounds.
| Compound | Class | Cumulative (μM) | Chronic (μM) | Source | #CAS |
| Nicotine | nAChRs agonist (addictive) | 1, 3, 10, 30, 100 | 1 | Sigma-Aldrich | 54-11-5 |
| Ethanol | GABAA R agonist (addictive) | 0.03%, 0.1%, 0.3%, 1%, 3% | 0.03% | Sigma-Aldrich | 64-17-5 |
| Flunitrazepam | GABAA R agonist (addictive) | 0.1, 0.3, 1, 3, 10 | 0.1 | Sigma-Aldrich | 1622-62-4 |
| Phenobarbital | GABAA R agonist (addictive) | 1, 3, 10, 30, 100 | 1 | Sigma-Aldrich | 50-06-6 |
| Methamphetamine | TAAR1 agonist (addictive) | 0.3, 1, 3, 10, 30 | 0.3 | Sumitomo Pharma | 537-46-2 |
| Varenicline | nAChRs agonist (non-addictive) | 0.1, 0.3, 1, 3, 10 | 0.1 | Sigma-Aldrich | 375815-87-5 |
| Muscimol | GABAA R agonist (non-addictive) | 3, 10, 30, 100, 300, 1,000 | 3 | Sigma-Aldrich | 2763-96-4 |
| Amantadine | Dopamine agonist (non-addictive) | 0.03, 0.1, 0.3, 1, 3 | 0.03 | Sigma-Aldrich | 768-94-5 |

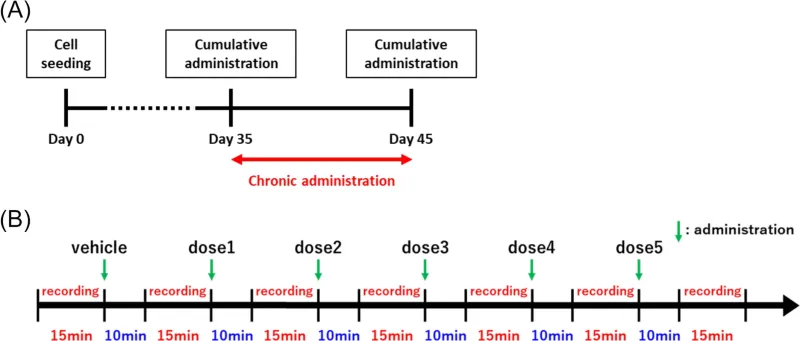
Schematic timeline for the experimental design. (A) Timeline of the whole experiment, including the chronic administration period. (B) Timeline of the cumulative administration experiment.

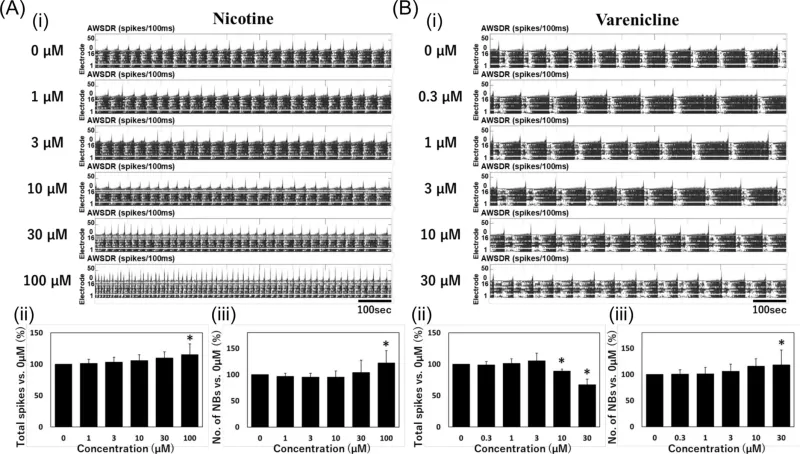
Electrophysiological responses of human iPS cell-derived dopaminergic neurons to nicotine and varenicline. (A) Electrophysiological responses to nicotine (n = 10 well). (i) Raster plot (upper) and histogram (lower). (ii) Total spikes. (iii) Number of network bursts. (B) Electrophysiological responses to varenicline (n = 10 well). (i) Raster plot and histogram. (ii) Total spikes. (iii) Number of network bursts. Error bars indicate the standard deviation. One-way ANOVA followed by Dunnett's test, *p < 0.05 versus 0 μM. AWSDR, array wide spike detection rate.

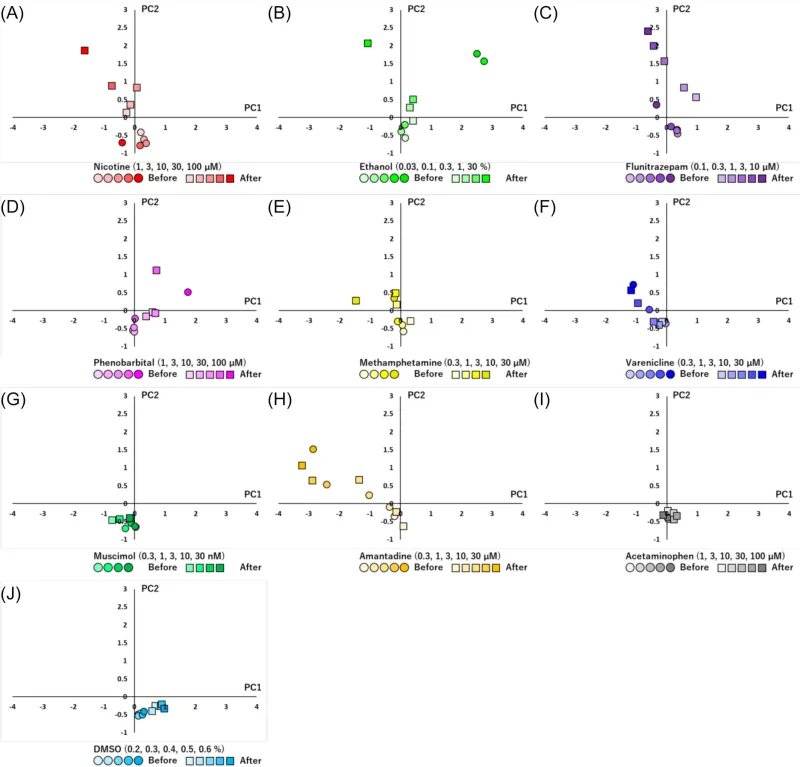
Comparative analysis of responsiveness before and after chronic administration for addictive and non-addictive compounds using PCA. PCA using effective analytical parameters to detect differences before and after chronic administration of addictive compounds. Plots per data point indicate the centroids. Before chronic administration (circle), after chronic administration (square). (A) Nicotine (n = 10 well), (B) ethanol (n = 10 well), (C) flunitrazepam (n = 10 well), (D) phenobarbital (n = 10 well), (E) methamphetamine (n = 10 well), (F) varenicline (n = 10 well), (G) muscimol (n = 8 well), (H) amantadine (n = 8 well), (I) acetaminophen (n = 10 well) and (J) DMSO (n = 10 well). Contribution rate of the PC1 is 52.4%, and PC2 is 29.2%.

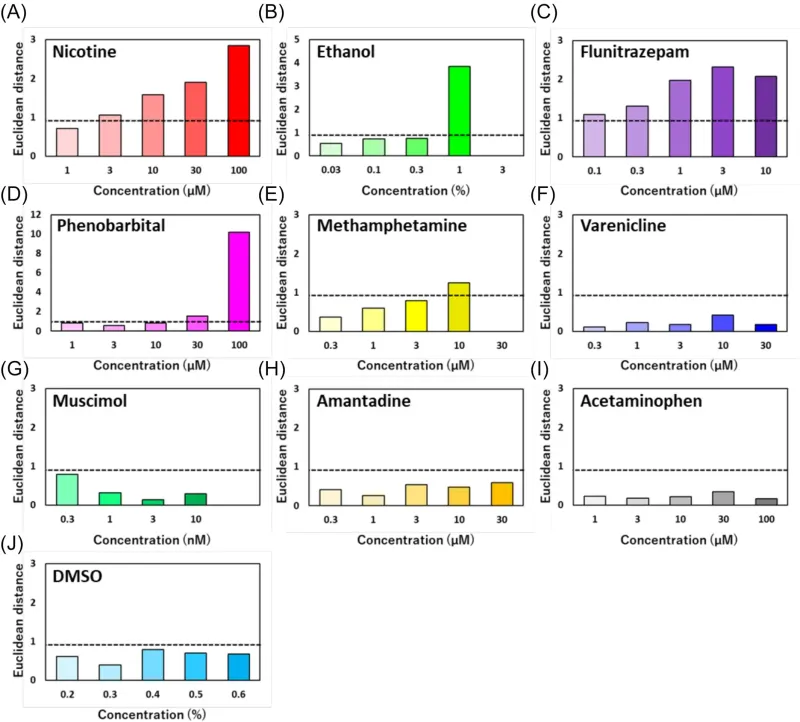
Distance on the two-dimensional plane of PCA before and after chronic administration. As a criterion for changes before and after chronic administration, the threshold was set at 2SD of the distance before and after chronic administration of DMSO (dashed line). (A) Nicotine, (B) ethanol, (C) flunitrazepam, (D) phenobarbital, (E) methamphetamine, (F) varenicline, (G) muscimol, (H) amantadine, (I) acetaminophen and (J) DMSO.