High-Density CMOS-MEA | Single-Cell Resolution for Drug Response Analysis
# Unveiling Neural Activity at Unprecedented Resolution
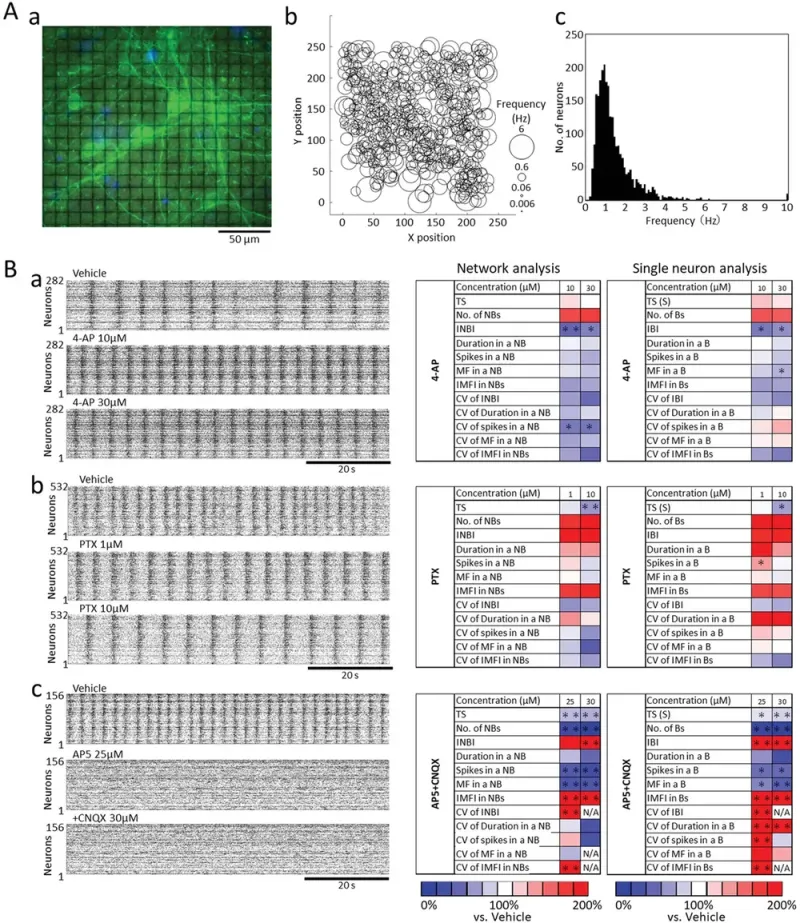
High-density (HD) CMOS-MEA with 236880-electrode enables unprecedented resolution of activity recordings. The study evaluates drug responses in hiPSC-derived cortical neurons using a high-density CMOS-MEA system. Neuronal activity was recorded at single-cell resolution across 324 electrodes, with individual neurons identified by grouping electrodes with similar firing patterns.
Spontaneous activity measurements detected an average of 285 neurons per well, with firing frequencies ranging from 0.029 to 9.994 Hz. The study compared network-wide vs. single-neuron activity after drug administration.
- 4-AP increased total spikes, bursts, and network bursts while decreasing spike variability.
- PTX (GABA-A inhibitor) increased burst duration, confirming functional GABAergic signaling.
- AP5 (NMDA antagonist) + CNQX (AMPA antagonist) reduced firing and burst parameters, verifying excitatory glutamatergic function.
Single-neuron analysis revealed greater variability in burst duration, spike counts, and firing frequency, highlighting the added value of cell-level resolution in drug response evaluation.
This approach demonstrates the power of HD-CMOS-MEA for high-resolution neural network analysis and its potential to enhance seizure liability assessment and drug discovery.

Network analysis and single neuron analysis to compound responses in hiPSC-derived cortical neurons. A) Spontaneous activity frequency of human iPS cell-derived cortical neurons per neuron. Spontaneous activity measurement and pharmacological tests were carried out after 42 days of culture. (a) Immunostaining image of human iPS cell-derived neurons cultured on CMOS-MEA (18 × 18 = 324 electrodes) at six weeks of culture. Green: β-tubulin III, Blue: Hoechest33258. (b) Spontaneous activity frequency per neuron detected by 235 × 252 = 59220 electrodes. The size of the circle indicates the spontaneous firing frequency of 532 neurons. (c) Histogram of spontaneous activity frequency per neuron (n = 9 CMOS-MEAs, n = 2569 neurons). B) Representative raster plots and heatmaps of network analysis and single neuron analysis for drug administration. (a) Vehicle, 4-AP 10 μm, 30 μm. (b) Vehicle, PTX 1 μm, 10 μm. (c) Vehicle, AP-5 25 μm AP-5+CNQX 30 μm. Heat map shows % versus vehicle = 100% (n = 3, *: p ≦ 0.05, **: p ≦ 0.01 versus vehicle, Dunnett's test). N/A: unable to calculate due to loss of burst. Parameters in network analysis [TS: Total spikes, No. of NBs: number of network bursts, INBI: Inter NB Interval, Duration in a NB, Spikes in a NB, MF in a NB: Maximum frequency in a NB, IMFI in NBs: Inter MF Interval in NBs, CV of INBI: Coefficient of variance (CV) of Inter NB Interval, CV of Duration in a NB, CV of spikes in a NB, CV of MF in a NB, CV of IMFI in NBs]. Parameters in single neuron analysis [TS(S): Total spikes per single neuron, No. of Bs: number of bursts, IBI: Inter burst Interval, Duration in a B, Spikes in a B, MF in a B: Maximum frequency in a B, IMFI in Bs: Inter MF Interval in Bs, CV of IBI: Coefficient of variance (CV) of Inter B Interval, CV of Duration in a B, CV of spikes in a B, CV of MF in a B, CV of IMFI in Bs.]