First Direct MEA Recording of Human Astrocyte Activity for Drug Assessment
# Unveiling Astrocyte Activity—A New Frontier in Drug Discovery
Discover a groundbreaking method for recording spontaneous human astrocyte activity using microelectrode arrays (MEA). This study introduces a novel low-frequency analysis approach to assess astrocytic slow oscillations and seizurogenic drug responses, paving the way for advanced in vitro drug screening.
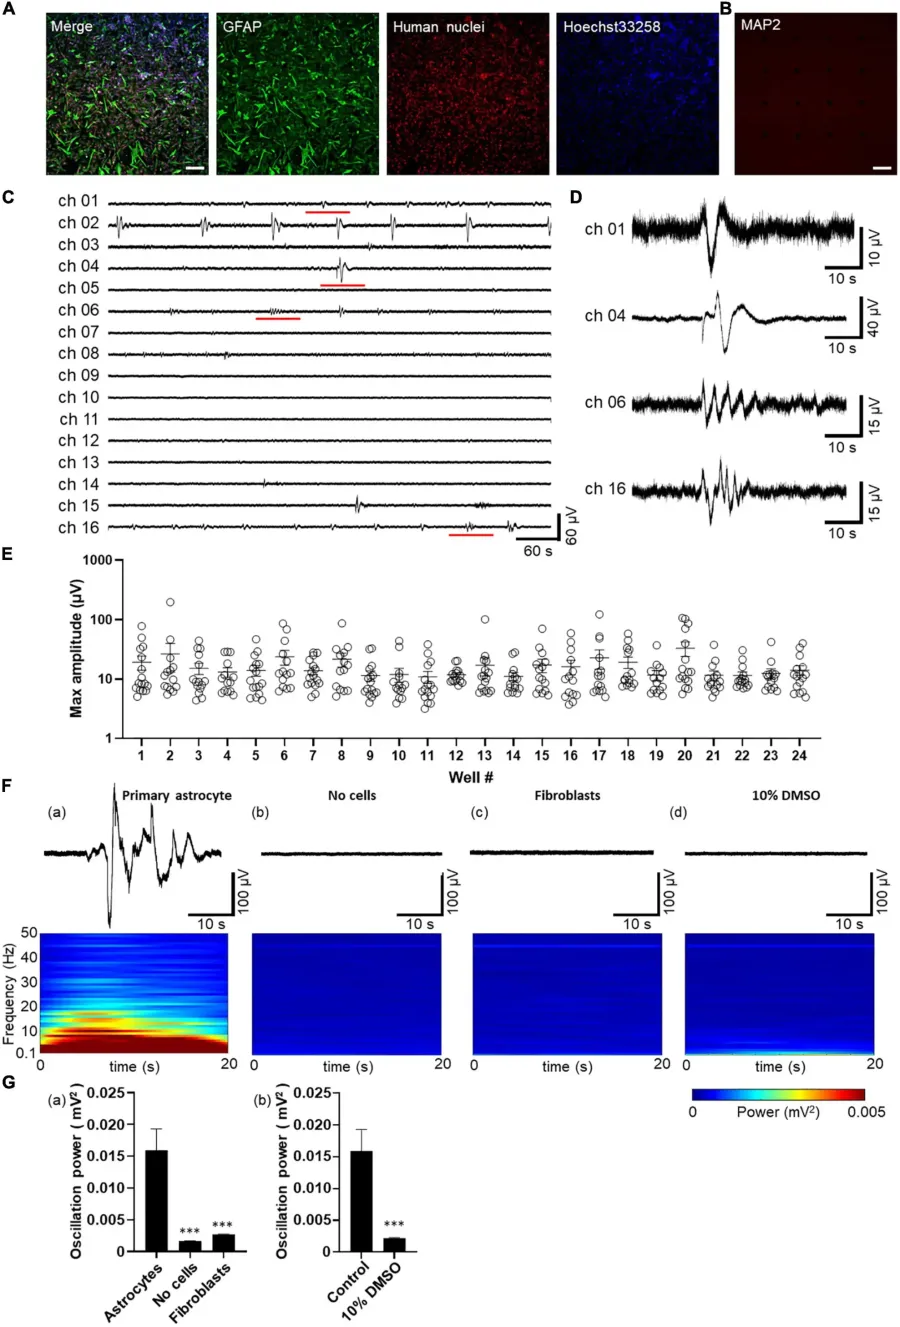
Spontaneous activity in human primary astrocytes detected by MEA.
(A,B) Immunofluorescent images of astrocytes cultured on MEA at 8 days in vitro (8 DIV). Immunocytochemistry of GFAP (green), human nuclei (red), cell nuclei by Hoechst 33,258 (blue), merged images in A, and MAP2 (red) in (B) Scale bar = 200 μm. (C) Representative oscillation waveform at the spontaneous activity measurement for 10 min at 7 DIV. (D) The magnified waveform of the red underlined time in (C). (E) Plot of maximum amplitude in 10 min oscillation waveform of each well. Error bars indicate the SEM. (F) Waveforms (upper panel) and their power spectrogram (lower panel) at maximum spectral intensity. (a) astrocytes, (b) no cells, (c) fibroblasts, (d) after 10% DMSO treatment. The vertical axis of the spectrogram shows the linear frequency from 0.1 Hz to 50 Hz, and the color indicates power. A 20 s spectrogram was extracted from the 40 s waveform. (G) Oscillation power of the control experiments. (a) Human primary astrocytes, no cells, fibroblasts, and (b) human primary astrocytes before and after 10% DMSO treatment. unpaired two-tailed t-tests, ***p < 0.001 versus astrocytes. Error bar, SEM.
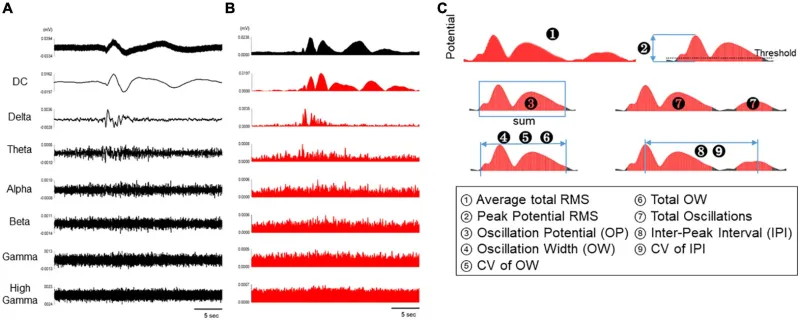
Analytical parameters of spontaneous activity in human primary astrocytes.
(A) Representative oscillation waveform of spontaneous activity in human primary astrocytes at 3 DIV (top), and waveform separated into seven frequency bands (DC, 0.1–1 Hz; delta, 1–4 Hz; theta, 4–8 Hz; alpha, 8–14 Hz; beta, 15–30 Hz; gamma, 35–50 Hz; high gamma, 80–150 Hz). (B) The waveforms in each frequency band were converted into RMS histograms. (C) Schematic diagram of analysis parameters. The red area are subject to analysis for each parameter.
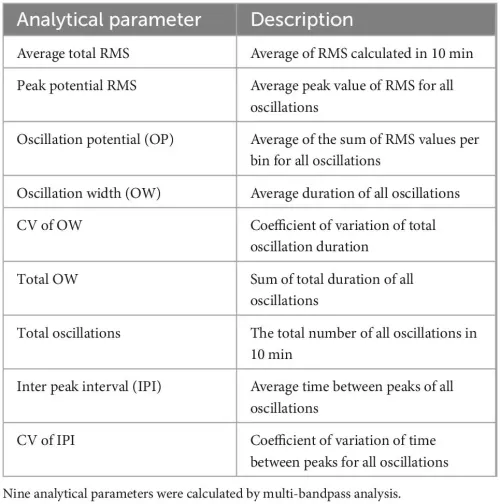
Description of analytical parameters.
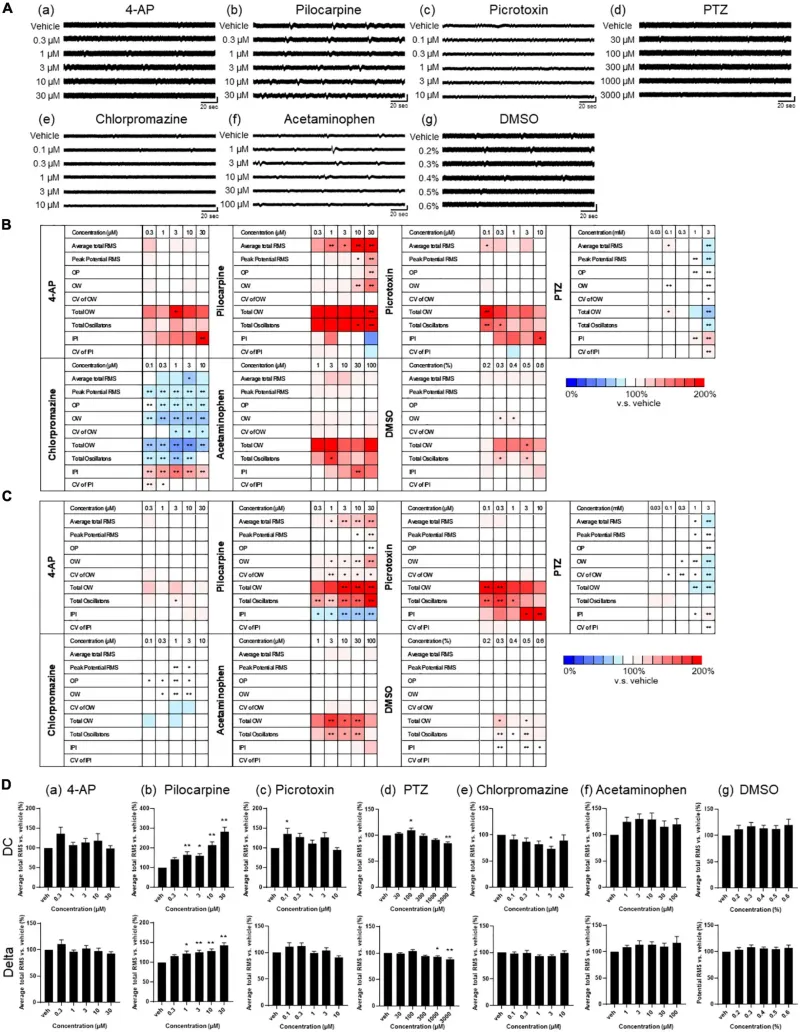
Drug responses of primary astrocytes detected by MEA. (A) Representative oscillation waveform after the cumulative administration of seizurogenic compounds (a) 4-AP, (b) pilocarpine, (c) picrotoxin, (d) PTZ, and (e) chlorpromazine, and neutral compounds (f) acetaminophen and (g) DMSO. Compounds were added to astrocytes during 1–3 weeks of the culture. Vertical scale bar, 40 μV; horizontal scale bar, 20 ms. (B,C) Heatmaps of the analytical parameters of seizurogenic compounds and neutral compounds in DC potential (B) and in delta band (C). 4-AP (n = 6), pilocarpine (n = 6), picrotoxin (n = 6), PTZ (n = 6), chlorpromazine (n = 6), acetaminophen (n = 6), and DMSO (n = 6). (D) Dose-dependent changes of average total RMS in DC potential (upper) and in delta band (lower). One-way ANOVA followed by Dunnett’s test, *p < 0.05, **p < 0.01 versus vehicle. Error bar, SEM.
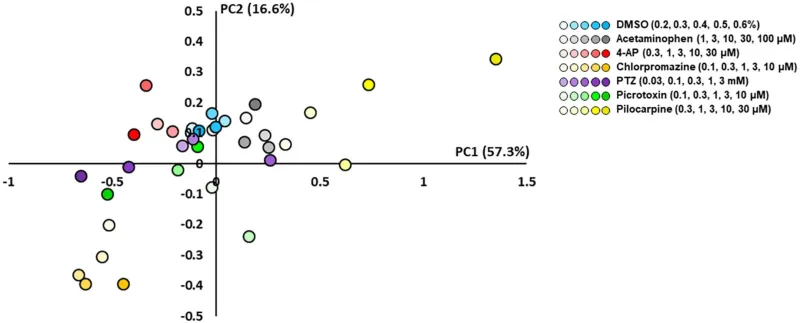
Scatterplots of principal component analysis (PCA) using the effective parameter set for detecting the drug responses of primary astrocytes. There was a clear separation between the seizurogenic and neutral compounds and between all seizurogenic compounds. In neutral compounds, DMSO and acetaminophen were not separated. DMSO (n = 6, blue), acetaminophen (n = 6, gray), 4-AP (n = 6, red), chlorpromazine (n = 6, orange), PTZ (n = 6, purple), picrotoxin (n = 6, green), and pilocarpine (n = 6, yellow). Higher concentrations are indicated by darker colored symbols.