Axonal Conduction Dynamics: Forward and Backpropagation in Neurons
# Mapping Neural Signals: Unveiling Axonal Propagation and Drug Responses
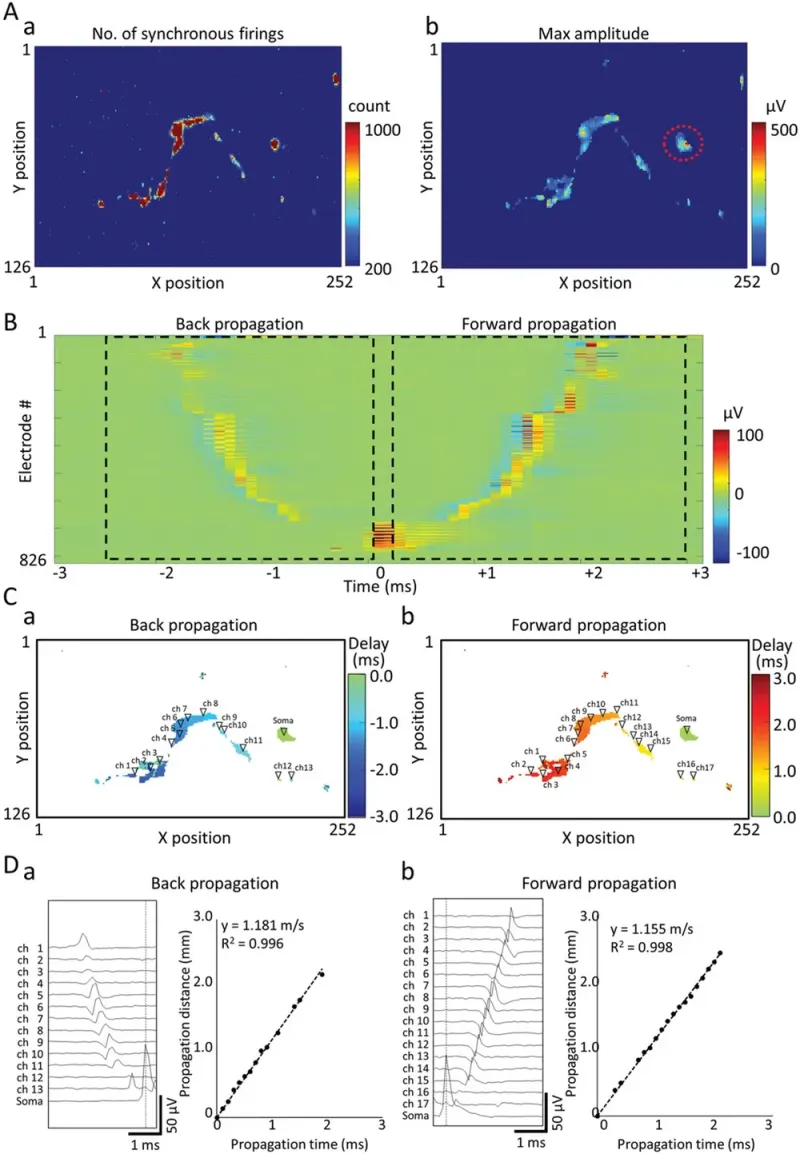
This study investigates axonal conduction pathways using high-density CMOS-MEA, focusing on both forward and backpropagation in neuronal activity. By detecting the maximum amplitude at each electrode every 0.05 seconds and analyzing synchronous firings within a 1 ms window, researchers mapped the conduction paths of 826 electrodes. The soma location was identified, showing a peak firing amplitude of 521.2 µV and a high-frequency spontaneous firing rate of 15.2 Hz.
Time-mapped voltage analysis revealed that forward propagation occurred for 3 ms after soma firing, while backpropagation was observed for 2 ms before soma firing. Interestingly, both propagation directions followed the same pathway, with backpropagation occurring in 41.6% of soma firings. Conduction velocity was calculated using cumulative distances between electrodes, showing that forward and backpropagation had nearly identical speeds—approximately 1.16 m/s—over distances of 2.18–2.44 mm.
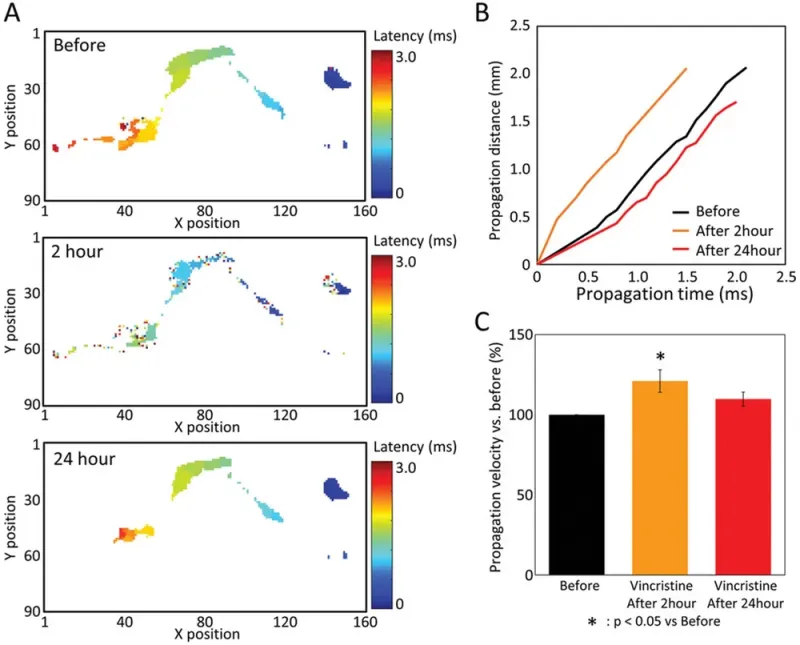
Additionally, the study examined how the anticancer drug vincristine affects axonal conduction velocity. Before administration, conduction velocity was 1.16 m/s. Two hours after vincristine treatment (3 nM), velocity increased to 1.37 m/s, while at 24 hours, it decreased to 0.85 m/s. Statistical analysis confirmed a significant 21% increase in conduction velocity at 2 hours, though the 24-hour change was not statistically significant.
These findings provide valuable insights into axonal conduction dynamics, highlighting the role of backpropagation in neural signaling and the potential effects of vincristine on neuronal function. This research enhances our understanding of how drugs can modulate neural conduction, which may have implications for neurotoxicity studies and therapeutic interventions.

Back propagation and forward propagation in single axonal conduction. A) Identification of soma electrode locations, (a) Number of synchronous firings map, (b) Maximum amplitude map of electrodes with more than 200 synchronous firings detected. The dotted line indicates the soma electrode area. B) Average potential heat map for 3 ms before and after soma firing. C) Conduction path and delay time map, (a) Heat map of back conduction 3 ms before soma firing, (b) Heat map of forward conduction 3 ms after soma firing. D) Electrode voltage waveform used for conduction velocity calculation (left). The dotted line indicates the firing time of the soma. Plot of conduction time and cumulative conduction distance (right). The dotted line is the approximate straight line calculated by the least squares method. (a) Back conduction, (b) Forward conduction.
Forward propagation was observed for 3 ms after soma firing. Propagation was also observed for about 2 ms before firing the soma. The forward propagation and back propagation had the same route

Change of axonal conduction velocity to anticancer drug vincristine. A) Heat map of forward propagation 3 ms after soma firing before and after vincristine administration. The upper row is before administration, the middle row is 2 h after administration, and the lower row is 24 h after administration. B) Plot of conduction time and cumulative conduction distance before and after vincristine administration. C) Change in the conduction velocity by vincristine. The parameters were depicted as the average % change of before (before set to 100%) ± SEM from n = 4 wells. Data were analyzed using one-way ANOVA followed by posthoc Dunnett's test (*p < 0.05 vs before).