AI-Powered Raster Plot Analysis for Predicting Drug-Induced Seizure Liability
# AI-Driven Seizure Liability Prediction — Advancing Drug Safety with MEA
Discover how deep learning and microelectrode array (MEA) analysis using iPSC-derived neurons enable high-accuracy seizure liability prediction and drug identification. This AI-driven approach achieves up to 99.9% accuracy in classifying seizure-causing compounds, paving the way for advanced in vitro toxicity assessment.
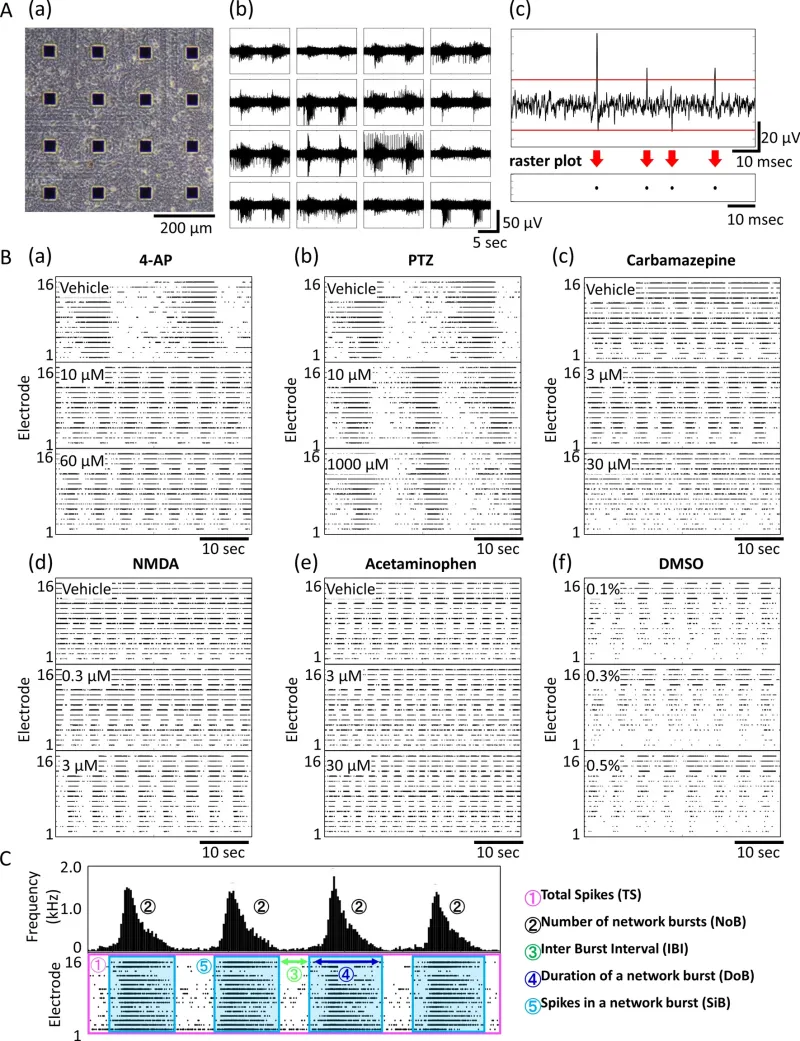
MEA data from a cultured human iPSC-derived neural network. (A) (a) Phase-contrast image of neurons on an MEA chip at 81 days in vitro (DIV). (b) Typical action potential waveform in a spontaneous recording. (c) Upper graph shows the action potential waveform acquired with a single electrode and the voltage threshold for spike detection (red line). Raster plots of detected spikes (black circles) are shown under the graph. (B) Concentration-dependent Raster plot images of typical mechanisms of action (a) 4-AP, (b) carbamazepine, (c) NMDA, (d) PTZ, (e) acetaminophen, (f) DMSO. (C) Schematic diagram of analysis parameters.
Dataset information using creation of seizure risk prediction AI.
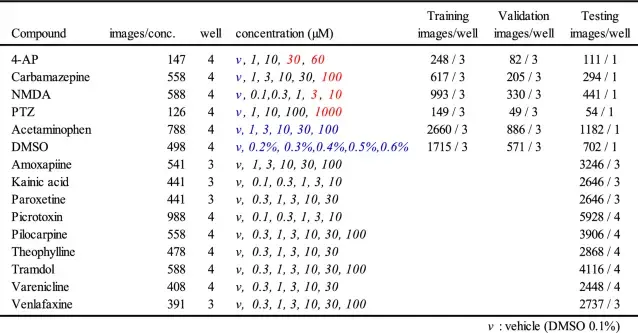
The concentration in red letters indicates the concentration learned as seizure-causing, and blue letters indicate the concentration learned as seizure-free.
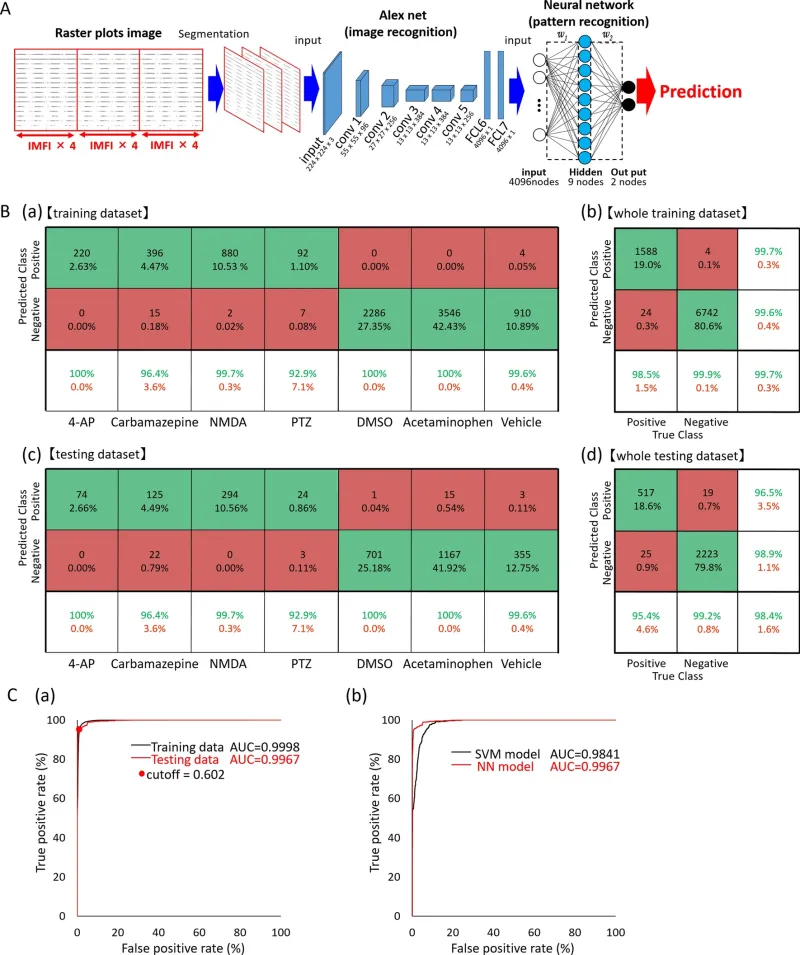
Creation of seizure risk prediction AI using raster plot images and evaluation of the prediction model. (A) Data flow and architecture of seizure risk prediction model. w1 is the weight between the input layer and the hidden layer, w2 is the weight between the hidden layer and the output layer. (B) (a) Confusion matrix for each compound used for training, (b) confusion matrix for the entire training dataset, (c) confusion matrix for each compound used for the test, (d) confusion matrix for the entire test dataset. The test dataset used the data of the wells not used for training dataset. Vehicle in the confusion matrix indicates vehicle data in four seizure-causing compounds. (C) (a) Receiver operating characteristic (ROC) curve after classification of training and testing data in a neural network model (black line: training data; red line: testing data; red dot: optimum operating point). (b) Comparison of ROC curves after classification of the same testing data in NN and SVM models (black line: SVM model; red line: NN model).
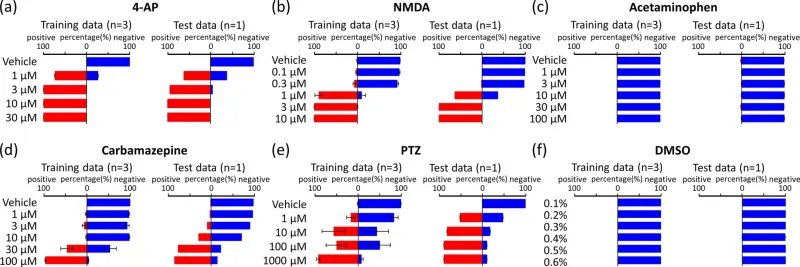
Concentration-dependent prediction of seizure risk in learning drugs by AI. AI predicted the negative probabilities (blue bar) and seizure risk (red bar) at each concentration of training data (left) and test data (right). (a) 4-AP, (b) NMDA, (c) acetaminophen, (d) carbamazepine, (e) PTZ, (f) DMSO.
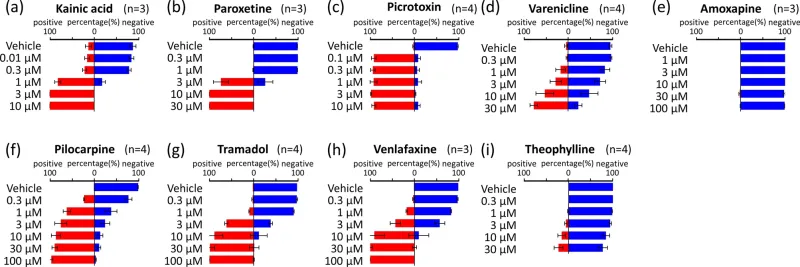
Concentration-dependent prediction of seizure risk in non-training drugs by AI. AI predicted the negative probabilities (blue bar) and seizure risk (red bar) at each concentration. (a) Kainic acid, (b) paroxetine, (c) picrotoxin, (d) varenicline, (e) amoxapine, (f) pilocarpine, (g) tramadol, (h) venlafaxine, (i) theophylline.
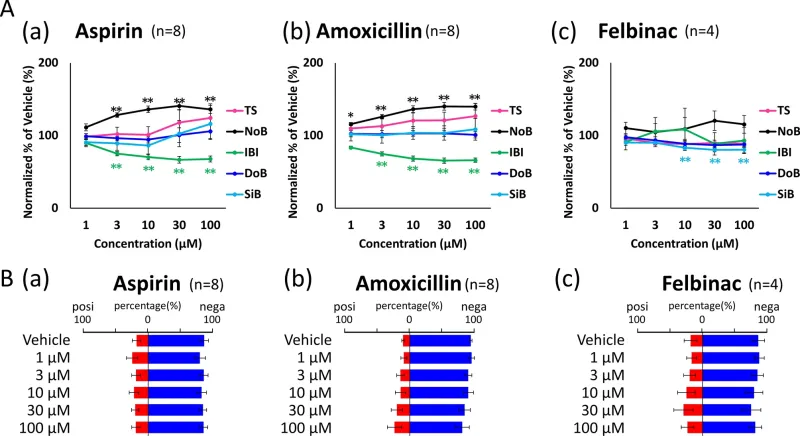
Prediction of seizure risk in non-training negative compounds by AI. (A) Concentration-dependent changes of 3 negative compounds in five parameters: TS (pink), NoB (black), IBI (green), DoB (blue), SiB (cyan). (a) Aspirin, (b) amoxicillin, (c) felbinac, (B) AI predicted the negative probabilities (blue bar) and seizure risk (red bar) at each concentration.
This AI can also identify compound and dose level
Dataset information used for the creation of drug name prediction AI
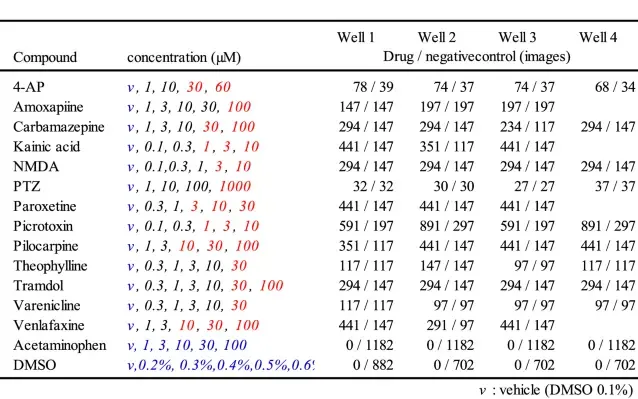
The concentrations in red letters indicate the concentrations used for learning the drug name, and blue letters indicate the concentration learned as negative control.
Probability of drug name in each concentration data predicted by AI
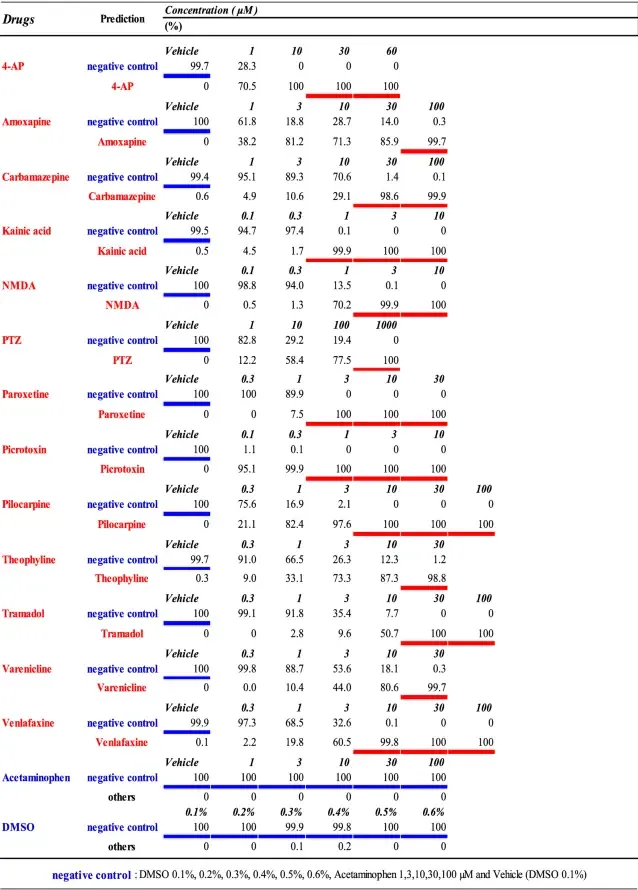
The underlining shows the concentration data used for learning the drug name (red), and the negative control (blue).