AI-Powered In Vitro Assessment of Chemotherapy-Induced Peripheral Neuropathy
# Enhancing CIPN Prediction with AI and Microphysiological Systems
This study presents a novel method for predicting chemotherapy-induced peripheral neuropathy (CIPN) using a microphysiological system (MPS) and deep learning-based image analysis of neuronal soma and axons.

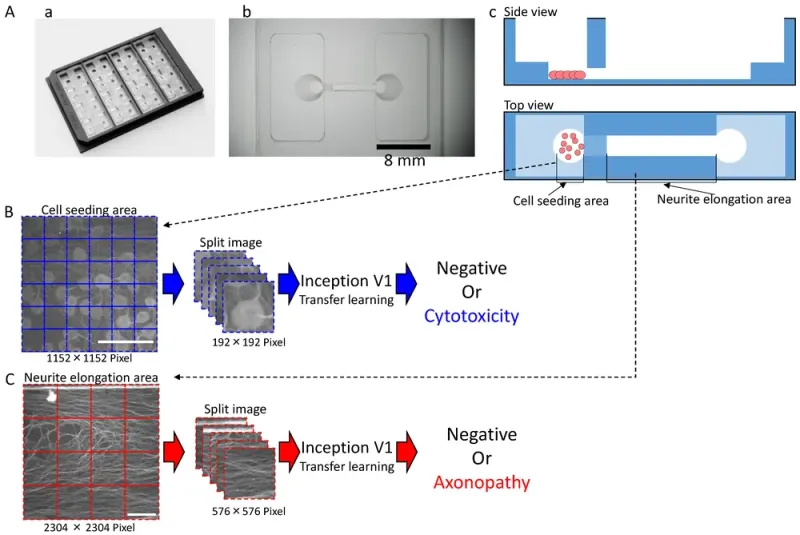
Shape of the microphysiological system (MPS) and the process for dataset processing and artificial intelligence (AI) analysis for deep learning: (A) MPS with (a) an overview; (b) Magnified view of a single channel. Scale bar = 8 mm; (c) Schematic of cultivation. (B) Dataset processing and AI analysis scheme for the cell seeding area. Scale bar = 200 μm. (C) Dataset processing and AI analysis scheme for the neuronal protrusion extension area. Scale bar = 200 μm.

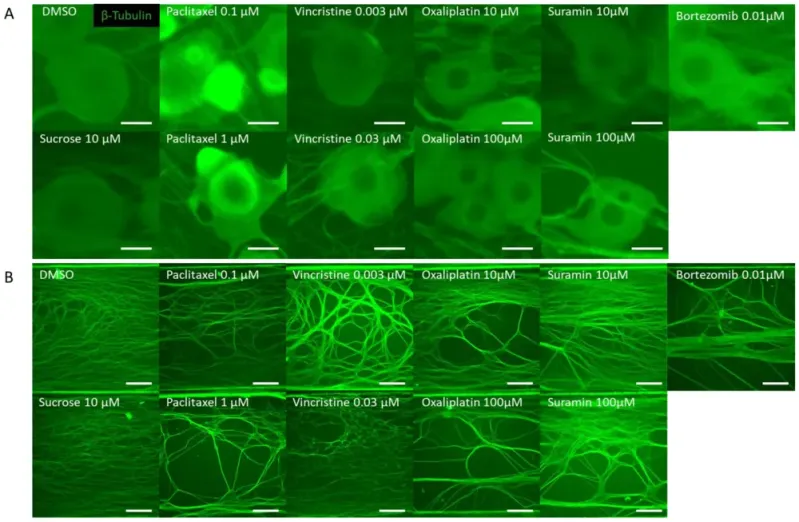
Representative β-Tubulin immunofluorescence images in the microfluidic device after drug administration. To verify the response to the compounds, rat dorsal root ganglion (DRG) neurons were cultured on the MPS device, exposed to the compound on day 14, and immunostaining images were taken 24 h later. The compounds used included DMSO as a vehicle, sucrose as a negative compound, paclitaxel and vincristine as anticancer drugs that cause axonal damage, and oxaliplatin, which induces somatic cell damage. Additionally, bortezomib, a proteasome inhibitor reported to cause chemotherapy-induced peripheral neuropathy (CIPN), and suramin, an antiparasitic drug with antitumor effects known to cause myelin damage, were selected as test compounds: (A) Representative local immunofluorescence images of soma. From left: DMSO 0.1% and sucrose at 10 µM. Paclitaxel at 0.1 µM and paclitaxel at 1 µM. Vincristine at 0.003 µM and vincristine at 0.03 µM. Oxaliplatin at 10 µM and oxaliplatin at 100 µM. Suramin at 10 µM and suramin at 100 µM. Bortezomib at 0.01 µM. Scale bar = 20 μm. (B) Representative local immunofluorescence images of axons. From left: DMSO 0.1% and sucrose at 10 µM. Paclitaxel at 0.1 µM and paclitaxel at 1 µM. Vincristine at 0.003 µM and vincristine at 0.03 µM. Oxaliplatin at 10 µM and oxaliplatin at 100 µM. Suramin at 10 µM and suramin at 100 µM. Bortezomib at 0.01 µM. Scale bar = 200 μm.

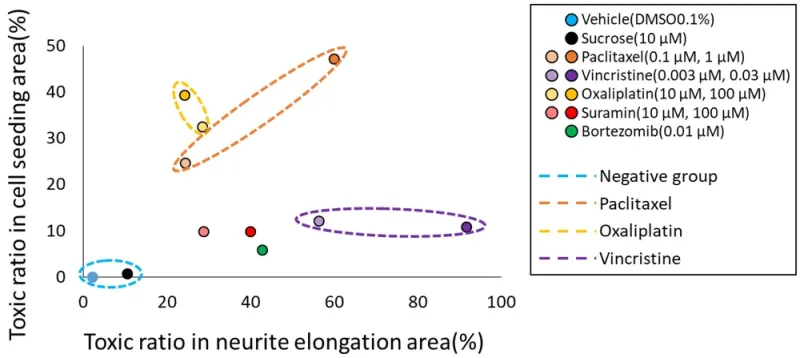
Classification of the mechanisms of action (MoA) of each compound based on the prediction results of two types of AI. To classify the MoA of anticancer drugs on neurons, we utilized the toxicity probability results from two distinct AI models. The toxicity probability in the soma area was taken as the vertical axis and in the axonal area as the horizontal axis. The graphical representation indicated that both DMSO and sucrose clustered near the origin. Meanwhile, oxaliplatin exhibited a predominant shift in the y-axis direction. In contrast, paclitaxel shifted in the upper-right quadrant, indicating a simultaneous increase in both axonopathy and cytotoxicity. Vincristine primarily moved in the x-axis direction, indicating its pronounced effect on axonal areas. The validation compound, suramin, showcased a dose-dependent shift along the x-axis. Another validation compound, bortezomib, positioned itself close to suramin at the 100 μM point.

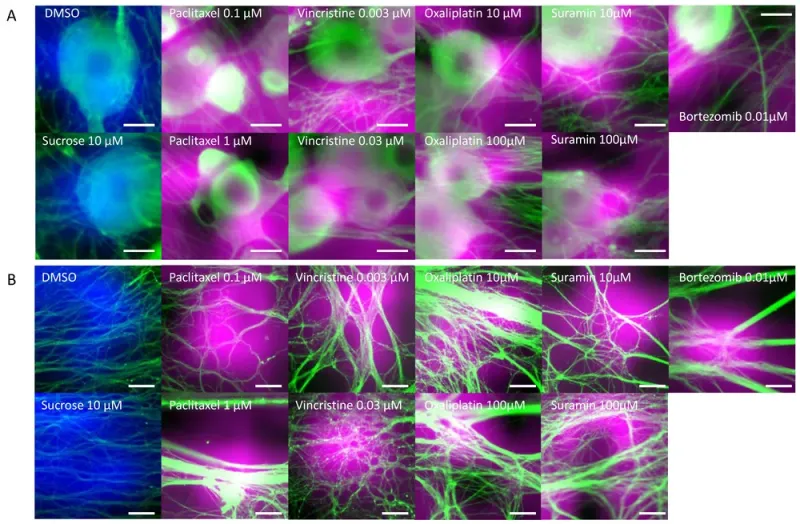
Areas of interest during AI toxicity determination. The areas that the AI focused on during toxicity determination were visualized using GradCAM: (A) Cellular areas on which AI focused during cellular toxicity determination. Areas colored in blue represent the areas focused on by the AI when cellular structures treated with DMSO and sucrose were determined to be negative. The areas colored in magenta represent the areas the AI focused on when cellular structures were determined to be damaged. Scale bar = 20 μm. (B) Axonal areas on which AI focused during axonopathy determination. Areas colored in blue represent the areas focused on by the AI when axons treated with DMSO and sucrose were determined to be negative. The areas colored in magenta represent the areas the AI focused on when axons were determined to be damaged. Scale bar = 50 μm.